How to Create Mermaid Diagrams

When you need to add diagrams to your website, docs, or PDFs, there are a lot of options. In today's agentic world, numero uno is use an AI agent like Claude or Codex, and those usually work ok. However, the more complex the diagram, the more messed up the lines and arrows become.
For example, I asked Claude with Opus 4.8 to create the same flowchart using mermaid and by hand (or by AI). Here is how it looks:
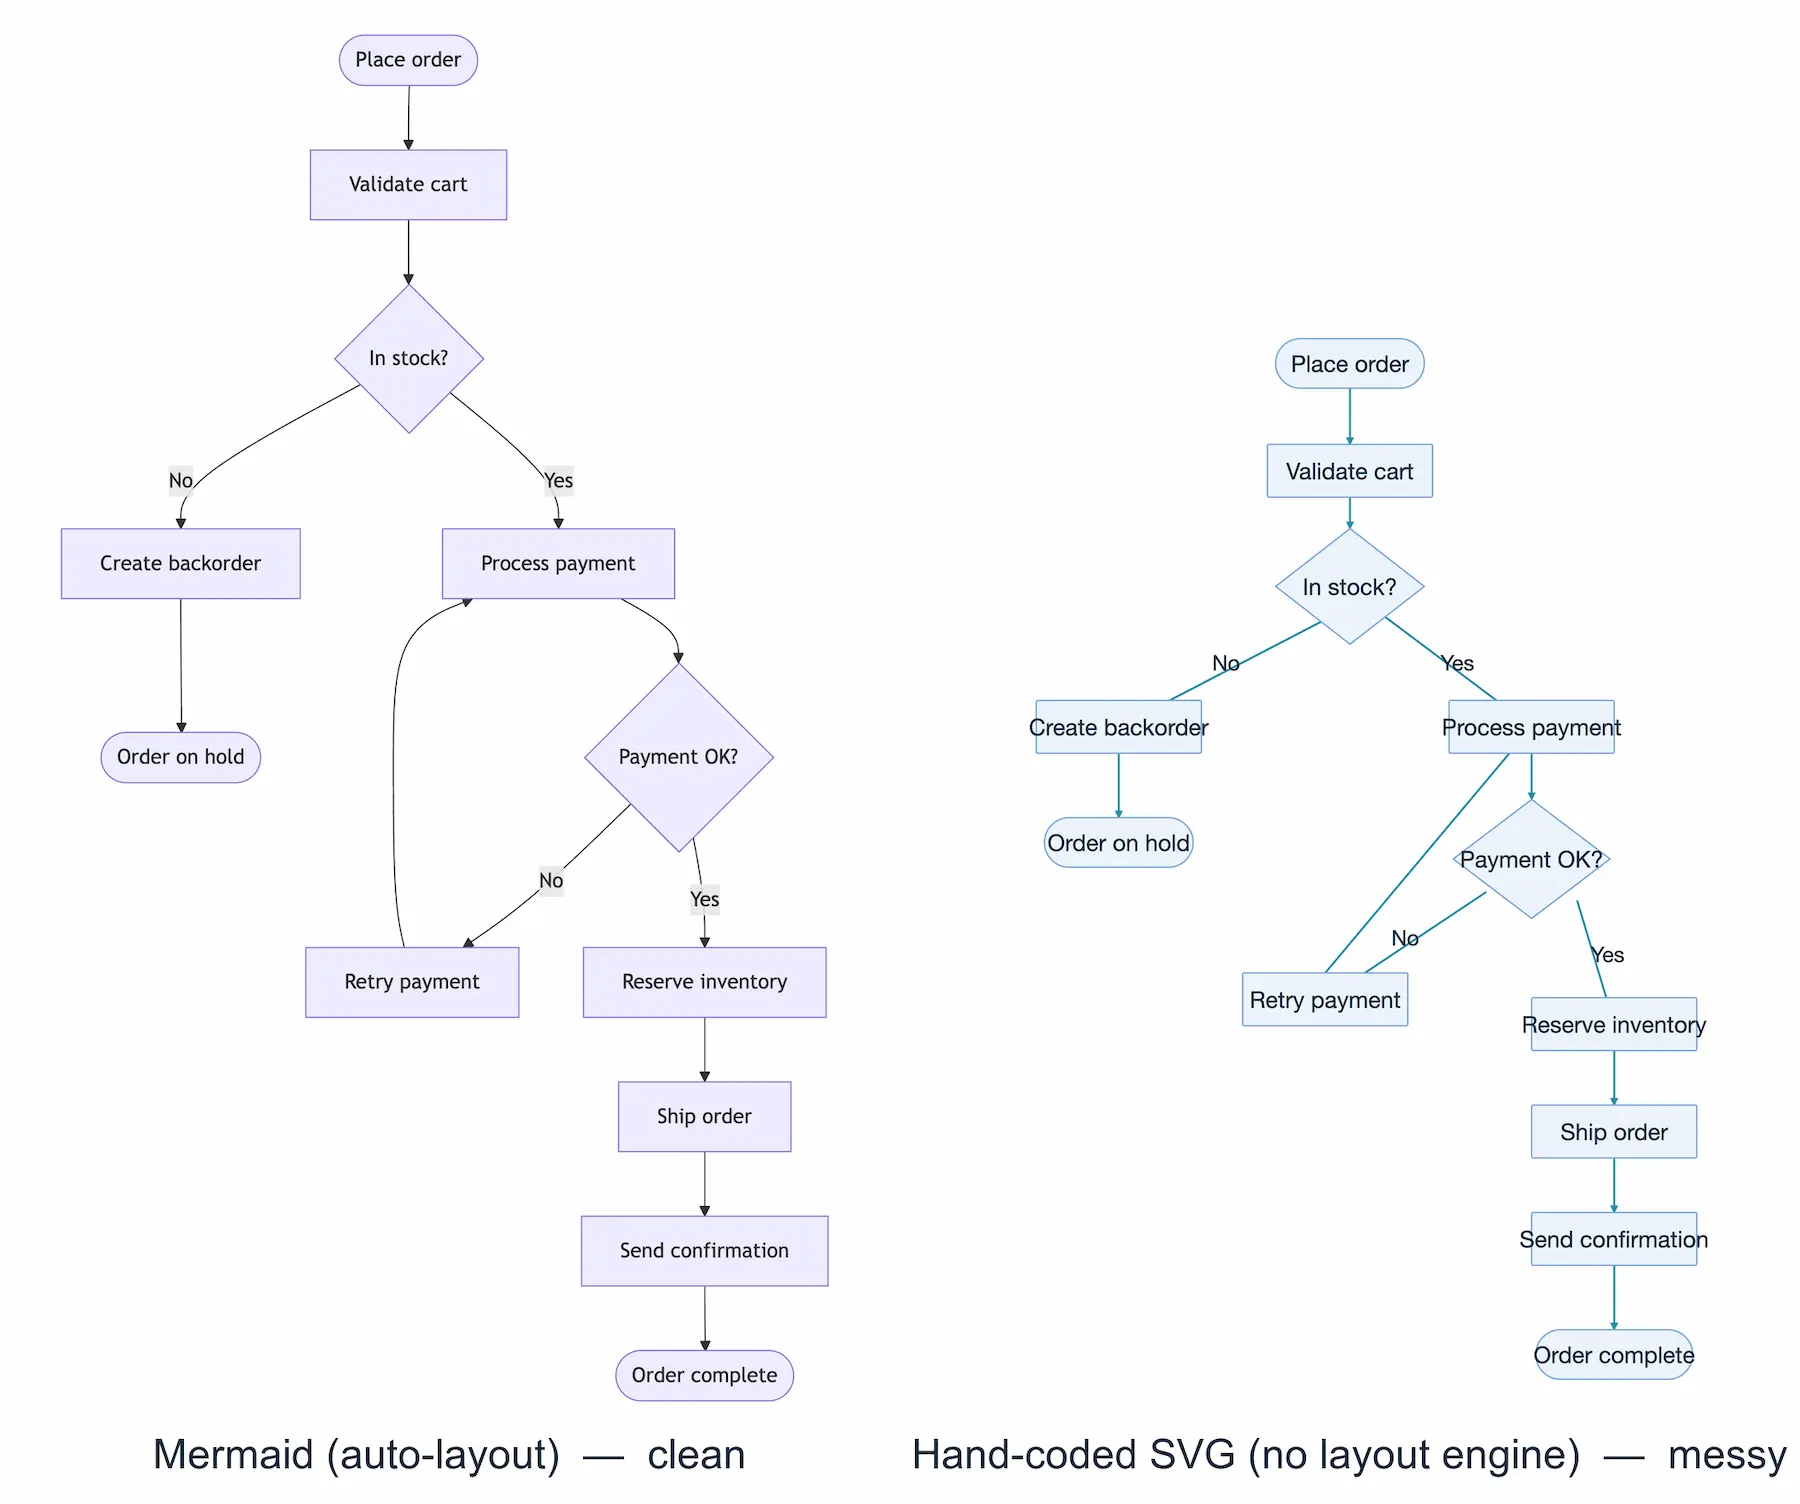
On the left is a Mermaid diagram and on the right is the AI generated diagram. You can see how messy it is with text going outside the boxes, no arrows, etc. This is why diagrams-as-code is so powerful, even in an agentic world.
So what is Mermaid? Essentially, Mermaid lets you write diagrams as plain text, commit them next to your code, and have the renderer draw them. You can change a line, open a pull request, and the diagram updates in the same review as the code it describes. This is why it is considered diagrams-as-code.
The alternative is the architecture PNG or SVG (which is code, so better) that you need to maintain separately and regenerate on any changes.
In the following sections, we'll cover the key areas of:
- The syntax rules that unlock every diagram type.
- Diagrams you can copy, paste, and adapt today.
- How to wire diagrams into your Git and docs workflow.
- The gotchas that trip people up, and where to write and preview.
Why Diagrams as Code Beats Drag-and-Drop
Mermaid is one of the default choices for text-based diagrams (others such as D2 also are popular), and the usage numbers prove it: about 9.8 million weekly downloads on npm and 88.9k stars on GitHub as of June 2026 (npm, 2026; GitHub, 2026).
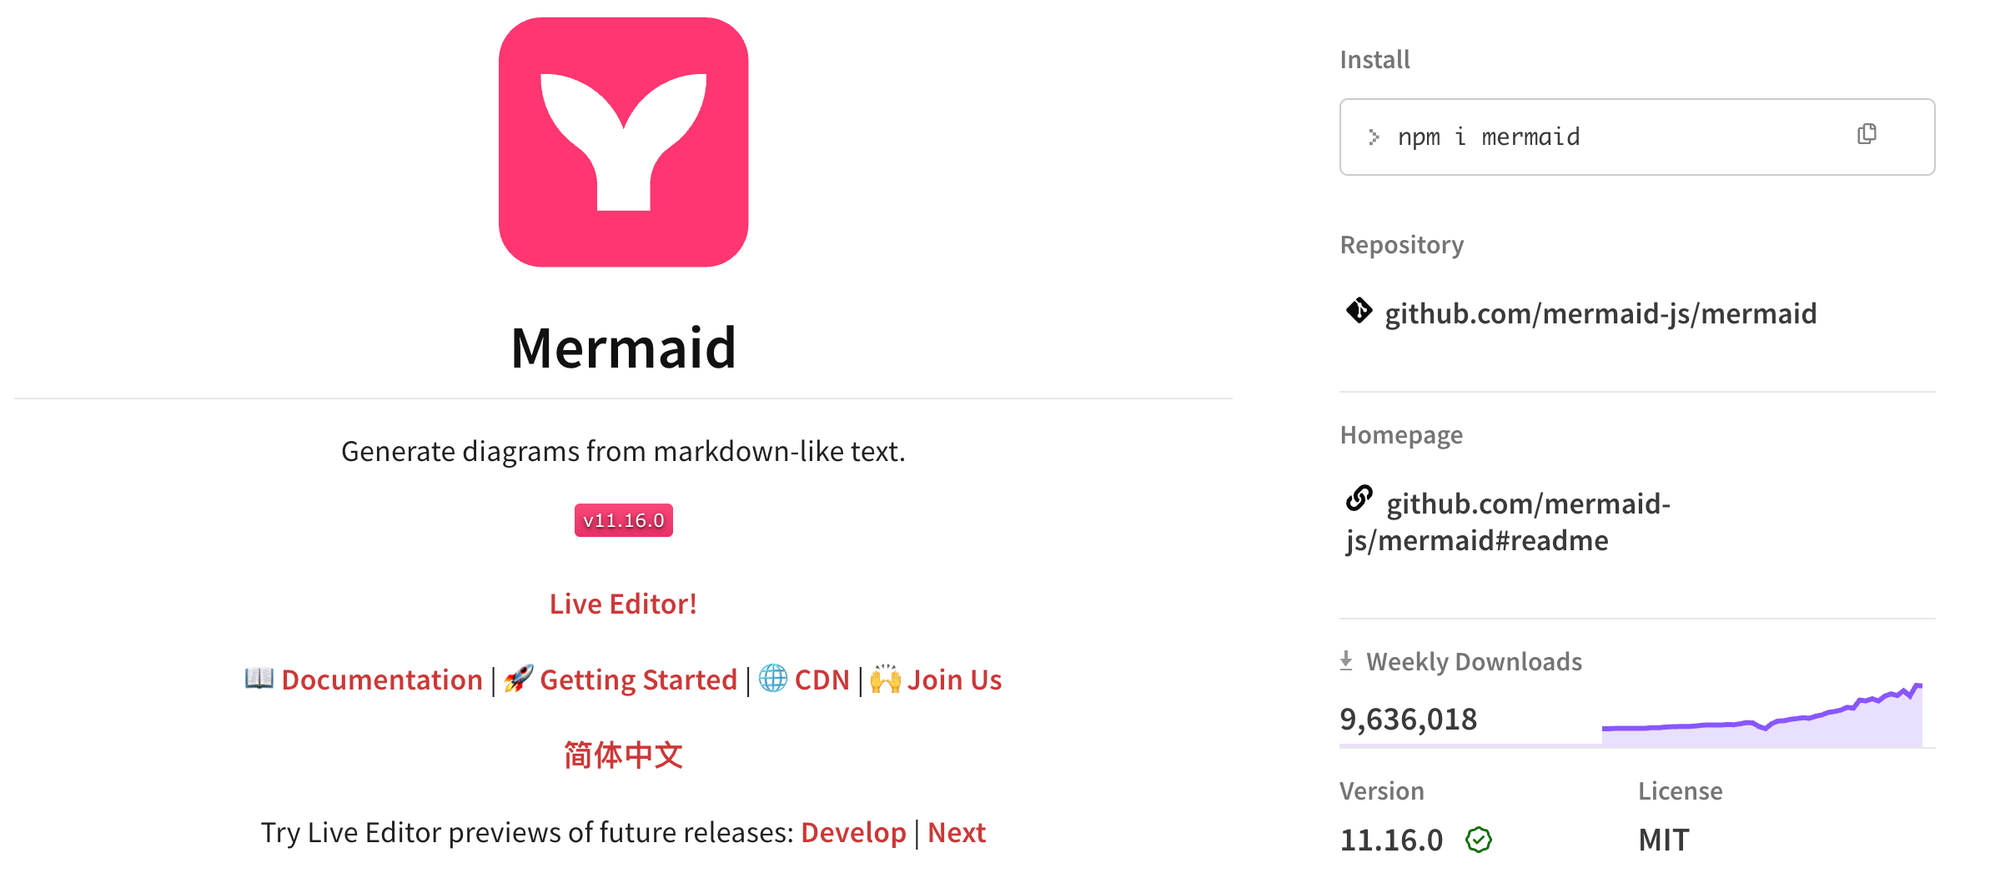
It's open source under the MIT license and free to use anywhere. Knut Sveidqvist created it, then built a company around it (TechCrunch, 2024).
The appeal of Mermaid is the workflow. A drag-and-drop diagram is a binary file that drifts out of sync the moment the system changes, because updating it is a separate chore from your actual work.
A Mermaid diagram is lines of text in the same repo as the thing it documents. It behaves like code because it is code.
The second awesome feature is portability. GitHub has drawn Mermaid blocks inside Markdown since February 2022, and GitLab, Notion, and Obsidian do too (GitHub Blog, 2022). You can paste the same snippet into a README, a wiki, or your docs tool and it renders with no plugin.
The Three Rules of Mermaid Syntax
Mermaid looks confusing until you notice that every diagram follows the same three rules, but if you're familiar with coding it's just a new syntax.
- Wrap it in a fenced code block tagged
mermaid. That's the signal renderers look for. - Declare the diagram type on the first line:
flowchart,sequenceDiagram,erDiagram, and so on. - Describe the nodes and the connections between them. Mermaid handles the layout, you just need to give the flow.
A simple example is a flowchart that reads top to bottom:
flowchart TD
    A[Start] --> B[Do the work] --> C[Ship it]
TD means top-down (LR is left-to-right), square brackets make a box, and --> draws an arrow. Everything below builds on those primitives.
Mermaid Diagram Examples
Mermaid handles a lot more than flowcharts. Below are seven of the most common types, each with the exact syntax and the rendered result. We generated every image here from the code block beside it, so copy any one into a Markdown file on GitHub and you'll see the same thing.
Flowcharts
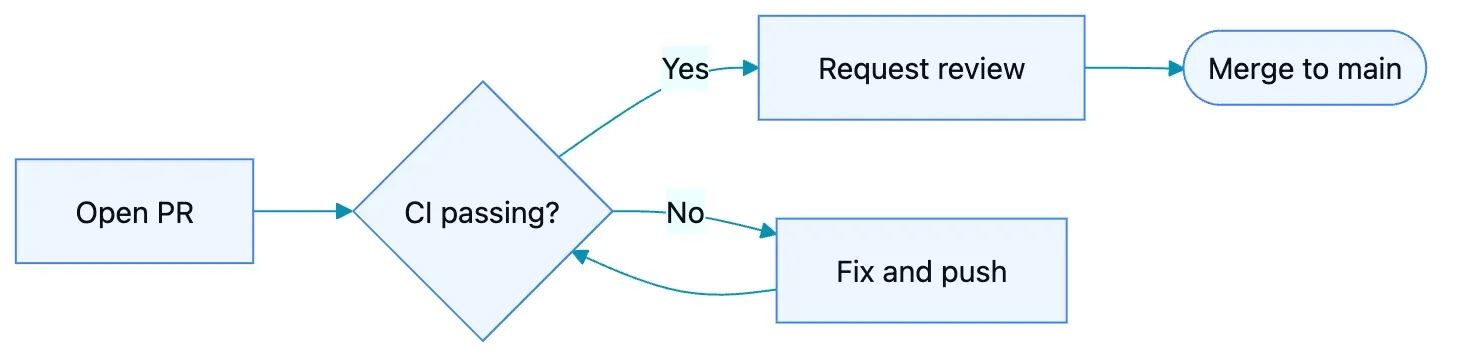
Flowcharts are the workhorse: any process with steps and branches. Use a curly-brace node ({ }) for a decision and label the branches with |Yes| style text.
You'll see two keywords for this, flowchart and the older graph. They render almost identically, but reach for flowchart, since that's where new features land.
flowchart LR
    A[Open PR] --> B{CI passing?}
    B -->|Yes| C[Request review]
    B -->|No| D[Fix and push]
    D --> B
    C --> E([Merge to main])
Sequence Diagrams
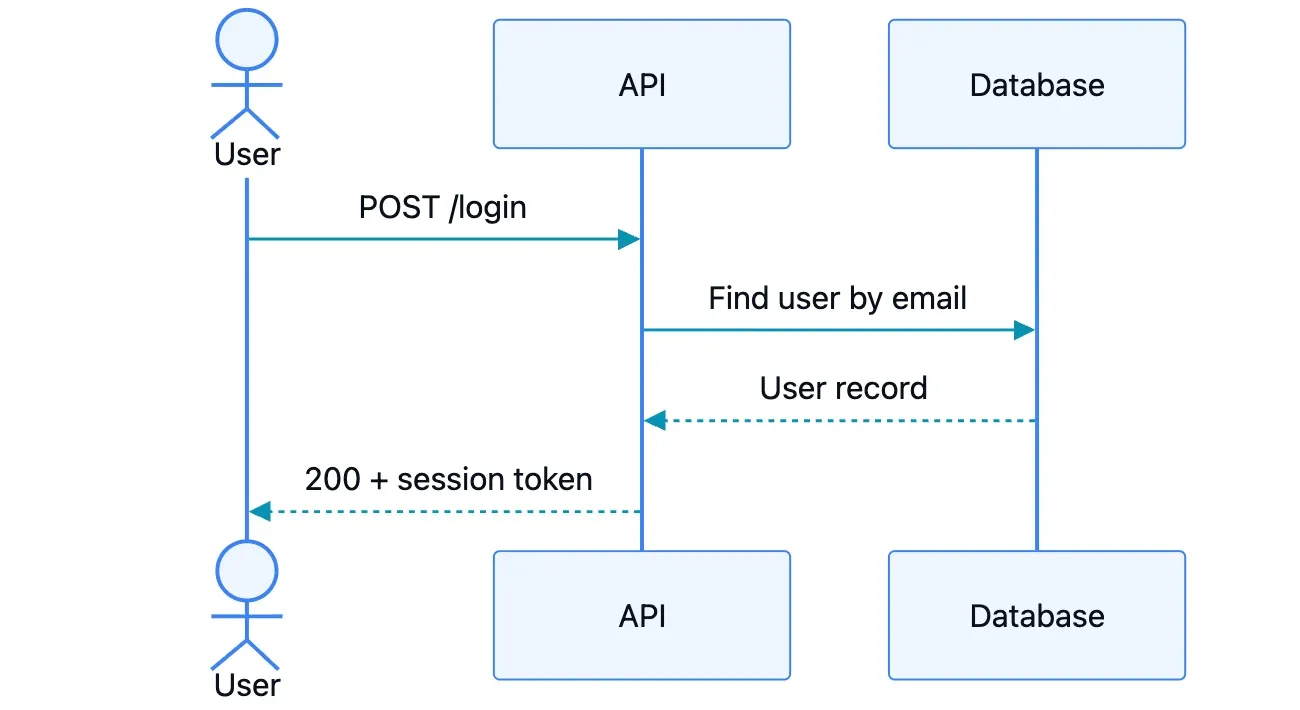
When you need to show who talks to whom and in what order, use a sequence diagram. For example, API requests, auth handshakes, or webhook retries. Solid arrows (->>) are calls; dashed arrows (-->>) are responses.
sequenceDiagram
    actor User
    participant API
    participant DB as Database
    User->>API: POST /login
    API->>DB: Find user by email
    DB-->>API: User record
    API-->>User: 200 + session token
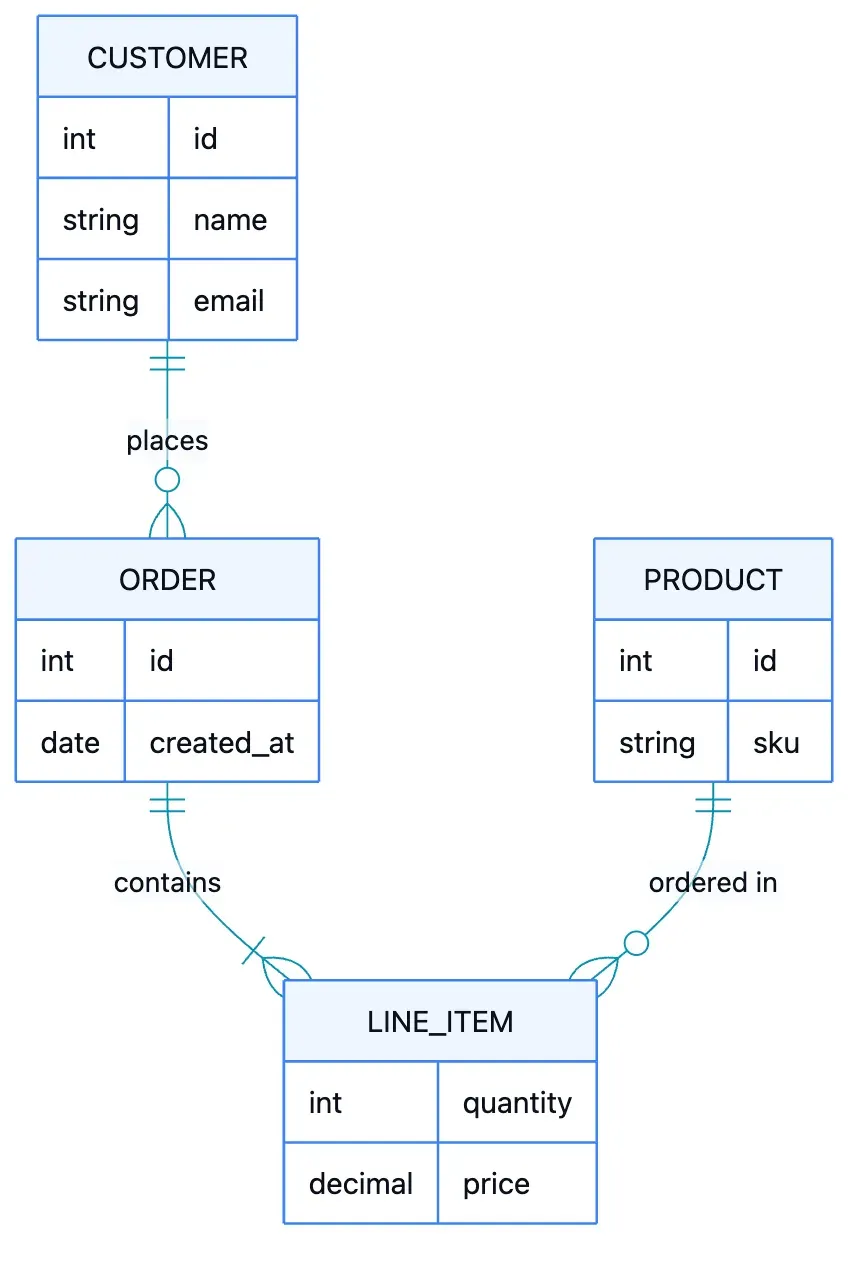
Entity Relationship Diagrams
ER diagrams document a database schema and the relationships between tables. The crow's-foot notation (||--o{) reads as "one customer places zero or many orders."
erDiagram
    CUSTOMER ||--o{ ORDER : places
    ORDER ||--|{ LINE_ITEM : contains
    PRODUCT ||--o{ LINE_ITEM : "ordered in"
    CUSTOMER {
        int id
        string name
        string email
    }
    ORDER {
        int id
        date created_at
    }
    LINE_ITEM {
        int quantity
        decimal price
    }
    PRODUCT {
        int id
        string sku
    }
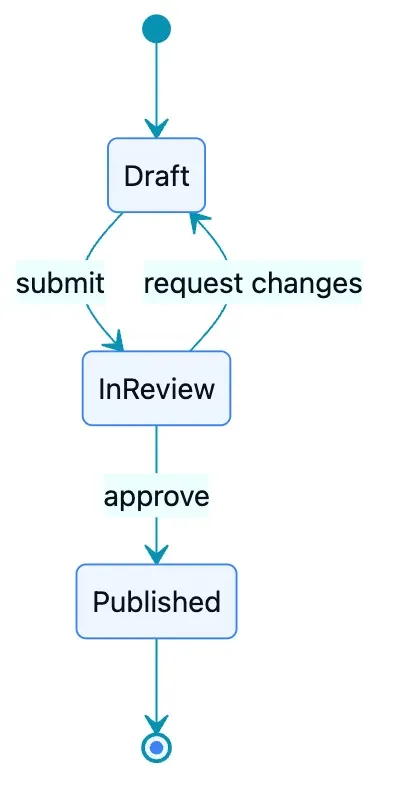
State Diagrams
A state diagram models a lifecycle: the states a thing can be in, and the events that move it between them. For example, a publishing workflow, an order status, or any finite-state machine. [*] marks the start and the end.
stateDiagram-v2
    [*] --> Draft
    Draft --> InReview: submit
    InReview --> Draft: request changes
    InReview --> Published: approve
    Published --> [*]
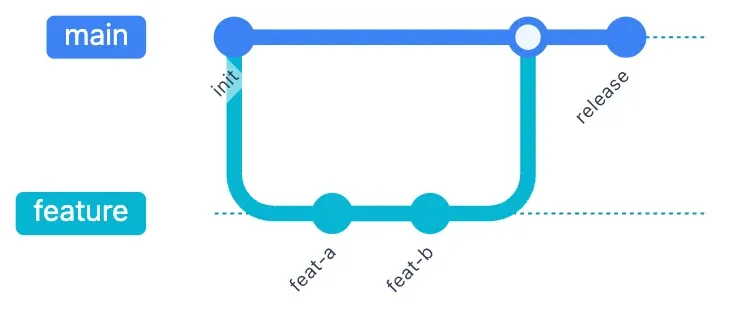
Git Graphs
A git graph draws branches and merges. It's a clear way to explain a branching strategy to a new contributor without screen-sharing your terminal. It also looks like a subway map.
gitGraph
    commit id: "init"
    branch feature
    checkout feature
    commit id: "feat-a"
    commit id: "feat-b"
    checkout main
    merge feature
    commit id: "release"
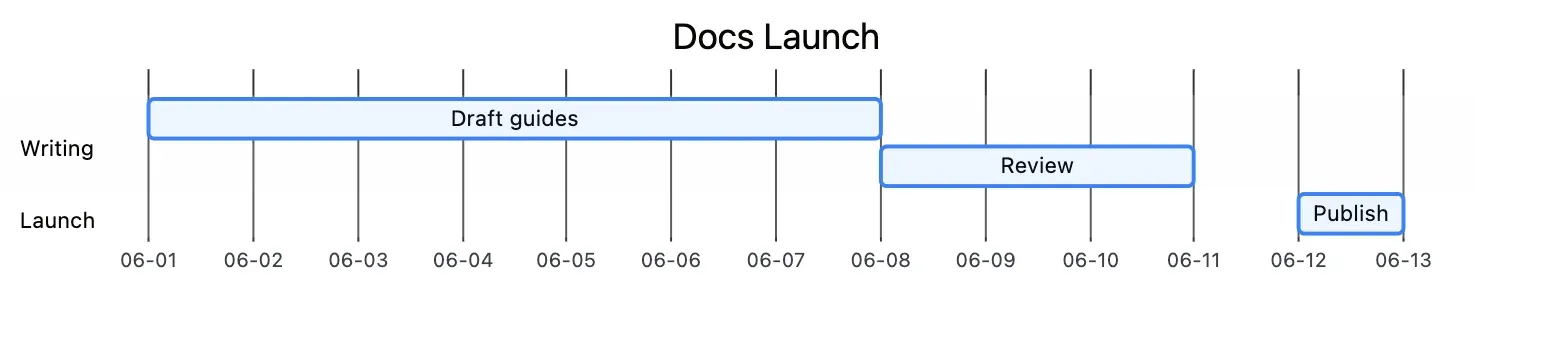
Gantt Charts
If you need to sketch a timeline without opening a project tool, use a Gantt chart to handle schedules, with sections, durations, and dependencies with the after keyword.
gantt
    title Docs Launch
    dateFormat YYYY-MM-DD
    axisFormat %m-%d
    section Writing
    Draft guides   :a1, 2026-06-01, 7d
    Review         :after a1, 3d
    section Launch
    Publish        :2026-06-12, 1d
Pie Charts
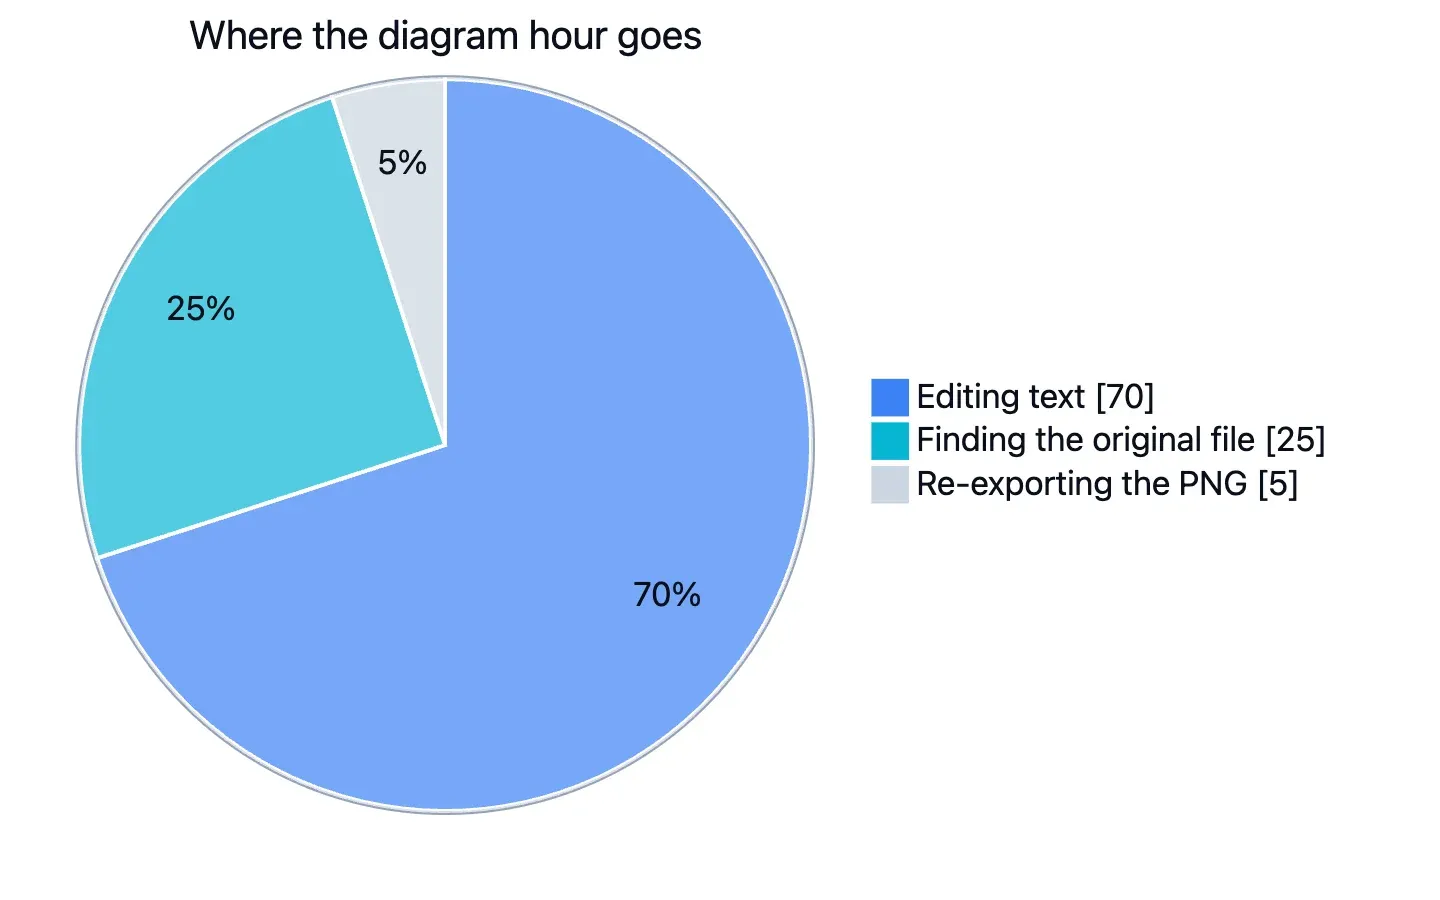
For proportions, use a pie chart. It is useful for lightweight status reports, incident summaries, and "where the time went" retros.
pie showData title Where the diagram hour goes
    "Editing text" : 70
    "Finding the original file" : 25
    "Re-exporting the PNG" : 5
The Workflow: Diagrams That Live in Your Pull Requests
The reason to bother with any of this is the PR workflow. Because a Mermaid diagram is text, it goes through the same process your code does.
Say we add a caching layer. In the same PR, we edit architecture.md, add a node to the flowchart, and push. The reviewer sees the diagram change rendered right in the GitHub diff, next to the code that caused it.
The team member can comment on it or update. If the PR gets reverted, the diagram reverts with it, keeping everything in sync.
Mermaid Tips and Tricks
The first tip if you run into rendering issues is to check which Mermaid version a platform runs. Just add an info block into a Markdown file and let it render:
info
GitHub will print the Mermaid version it's running, which saves you guessing why a newer diagram type won't draw (GitHub Docs, 2026).
Next, Mermaid is forgiving until it isn't.
Special characters are the big one. If a label contains syntax-like characters, wrap the text in quotes: A["GET /users (v2)"].
Big diagrams can also cause issues. Past 15 or so nodes the auto-layout might not render properly and the diagram looks like a mess. We recommend splitting one diagram into several, which is why our docs guidance caps each diagram at 10 to 15 nodes.
Indentation also matters in some diagram types (i.e. mindmap), so when the syntax looks right but nothing draws, review the whitespace.
Where to Write and Preview Mermaid
The render-on-save loop is what makes Mermaid pleasant, so write somewhere you can watch the diagram appear as you type. A few good options:
- A live editor. We built the Jamdesk Mermaid editor because the previews we'd been using blanked the whole diagram the second we typed a syntax error. Ours keeps the last valid render on screen while you fix the typo and shows the parser error inline. It's free and open-source (Apache 2.0), runs entirely in your browser, and can export the Mermaid diagram as an SVG.
- VS Code. A Mermaid preview extension renders diagrams beside your Markdown, so you never leave the editor.
- GitHub itself. For a small tweak, edit the Markdown file in GitHub's web editor and watch the Preview tab.
If you publish documentation, check whether your platform renders Mermaid natively so you can drop a mermaid code block into any page and it renders, with the diagram adapting to light and dark mode automatically.
When a platform has no native support, the Mermaid CLI renders any diagram to a PNG or SVG you can embed as a normal image.
Summary
Mermaid diagrams are great because they live in the repo, change in the same pull request as the code, and render the same on GitHub as they do in our docs.
However, it isn't the right tool for everything. If you need pixel-perfect marketing graphics or freeform whiteboarding, try Figma. Basically, Mermaid's auto-layout trades fine control for speed/ease and are great for the technical diagrams that sit in your documentation and go stale the fastest.
If you want another diagrams-as-code language, D2 is worth a look. D2 has a clean graph syntax for some layouts, while Mermaid has broader native support across Markdown tools.